Welcome to an in-depth journey through the cutting-edge world of Near-Infrared (NIR) Spectroscopy as applied by NIRLAB, a leader in forensic and substance analysis technology. Today, we’re delving into a spectrum that might seem like a mere collection of peaks and troughs to the uninitiated but reveals a story of molecular interaction and sophisticated identification processes.
Let’s embark on a step-by-step exploration of a heroin sample analysis, visualized through NIRLAB’s intuitive application, to understand how this technology is pivotal in substance identification.
Example of NIR Data Analysis
Step 1: Capturing the Spectrum
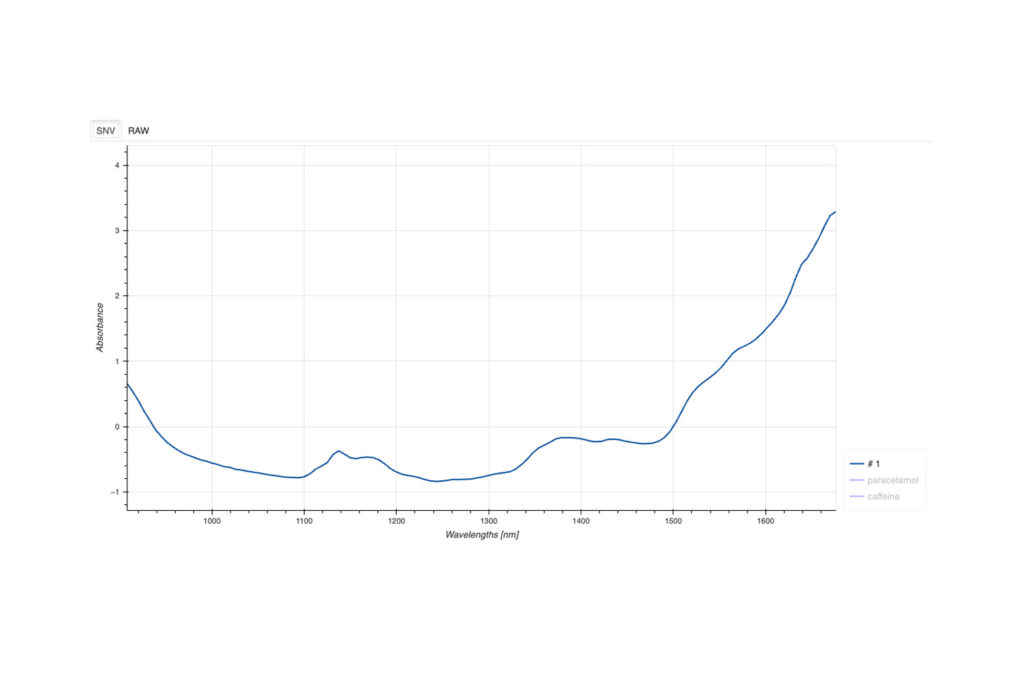
Our journey begins with a non-homogenized powder, presumed to contain heroin. The near Infrared spectroscopy device by NIRLAB, in direct contact with the sample, emits light in the near-infrared range. As this light penetrates the sample, some wavelengths are absorbed by the sample’s molecules, while others are reflected back. Furthermore, these interactions are captured by the device, creating a raw spectral graph.
Step 2: NIR Absorption Peaks – The Substance’s Fingerprint
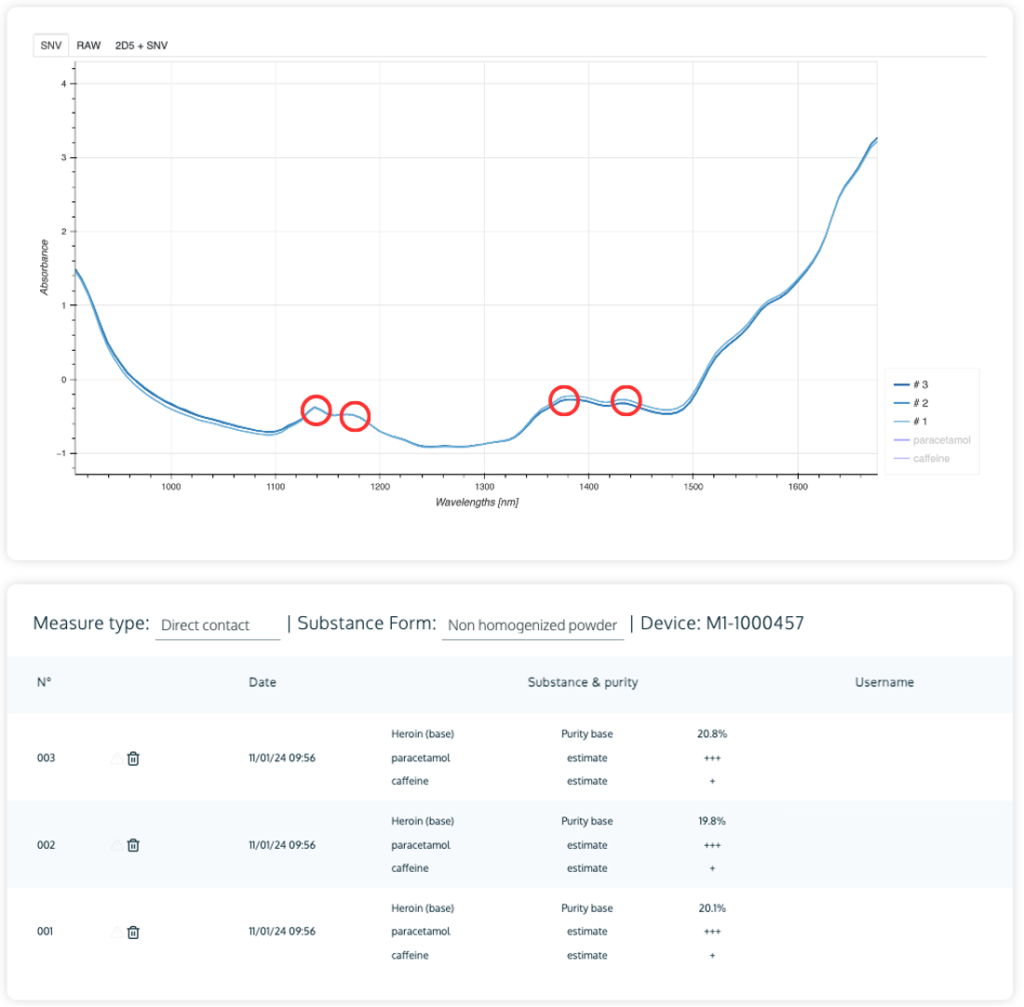
The graph you see above is a representation of how different wavelengths of Near IR light interact with the sample. Notice the peaks circled in red? These are the absorption peaks, unique identifiers for the molecules present. They occur at specific wavelengths where the sample’s molecular bonds vibrate in response to the NIR light, a concept similar to how a guitar string vibrates at a particular frequency when plucked.
Step 3: The Role of Machine Learning
Enter the advanced machine learning algorithms developed by NIRLAB. These algorithms compare the absorption peaks from the sample’s spectrum to a vast library of known substances. This library encompasses more than 40’000 different spectrum. Much like matching a fingerprint at a crime scene, the software analyzes the patterns to identify which substances are present and estimates their concentrations.
Step 4: Substance Identification and Purity Estimation
The table below the spectrum provides a concise summary of NIRLAB’s findings. In the case of our sample, we observe three separate readings, each confirming the presence of heroin and providing a purity estimate. For instance, heroin’s purity varies slightly in each measurement, which could be due to sample non-homogeneity. Moreover, paracetamol and caffeine are also detected, indicated by the “+” signs, suggesting their presence at varying concentrations.
Step 5: Data Analysis and Reporting
NIRLAB’s application doesn’t just stop at identification; it processes the collected data in real-time, offering actionable insights almost instantaneously. This rapid reporting is crucial in fields where timely decisions can make a world of difference, such as law enforcement and pharmaceutical quality control. Additionally, to learn more about this, check out our blog: “Insightful NIR Technology: A Key to Effective Drug Trafficking in Law Enforcement“
Step 6: Understanding Molecular Vibration
You might wonder, what causes these absorption peaks? This is where the molecular vibration caused by NIR light comes into play. Each molecule has a characteristic way of vibrating when exposed to certain frequencies of light. Hence, these vibrations are like the molecule’s way of responding to the energy of the near infrared light. For a more in-depth discussion on molecular vibration and NIR light, check our blog that shines a light on the molecular dance within your samples here.
Conclusion: The Power of NIR Spectroscopy with NIRLAB
What we’ve unpacked here is just the tip of the iceberg. Near IR spectroscopy, especially when powered by NIRLAB’s sophisticated software, opens up a new realm of possibilities in substance analysis. Also iIt’s a non-invasive, fast, and accurate method to peek into the molecular world of various substances.
With NIRLAB’s innovative approach, understanding the complex language of molecules becomes a story narrated through spectra, accessible not just to scientists but to anyone interested in the fascinating world of NIR spectroscopy. Want to see NIRLAB’s technology in action? Visit our blog page, here or reach out for a personalized demonstration at contact@nirlab.com. Witness firsthand the precision and efficiency that NIRLAB brings to substance analysis.
NIRLAB // Just Truth
